114 of 114 winners on Last Touch over 2 years ›

Option income, explained.

Five short puts and put spreads each weekday morning. Every one checked, and explained in plain English: what you'd collect, what you'd risk, and why it made the list.

Free account, no card needed.  ·  Or start the 7-day trial

No earnings before expirationLiquid options onlyA new set every weekday
Short putSLV · SLV · $53.41 now

Get paid $60 to agree to buy SLV at $48, until Nov 20.

If SLV stays above $48
You keep $60
1.3% on your cash in 42 days
If SLV falls below $48
You buy 100 shares
Really $47.40 each, after the $60
Cash you set aside
$4,800
Held by your broker until Nov 20

Why it made the list

Strike sits at or below a tested support zone near $51
Hasn't closed at or below $48 in 226 days
No earnings report before Nov 20

Trade summary

Sell 1 SLV Nov 20 $48 put · 16-delta
Collect: $0.60 × 100 shares (1 contract) = $60
If assigned: 100 shares × $48 = $4,800 ($4,740 after the premium)

Before you place it

Only sell this put if you'd be happy owning SLV at $47.40. If bad news hits, the stock can fall well below that, and you'd still buy at $48.

In your broker, look for the Nov 20 $48 put and sell 1 contract. The premium shown is from the latest scan; check the live price first.
An example Today's Picks card. Educational, not a recommendation.

How our setups turned out

114 of 114 winners on Last Touch over 2 years

Last Touch over 2 years: when we found the setup, the stock had not closed at or below the strike in more than 2 years. Every setup our scanner recorded for each expiration, losses included.*

Last Touch over 2 years · Oct 16 + Oct 30
114 / 114
winners
+$7,610
held to expiration
+$4,831
closed at 50% profit

Every one of these strikes was one the stock hadn't closed at or below in over 2 years. The Over 2 years scan finds them for you each day.

In Starter and Pro.

Held
Closed at 50%
Oct 16 expiration
Last Touch over 2 years
72 of 72
+$3,542
72 of 72
+$2,317
Every setup
805 of 924
87% winners
888 of 924
96% winners
Oct 30 expiration
Last Touch over 2 years
42 of 42
+$4,068
42 of 42
+$2,514
Every setup
226 of 324
70% winners
301 of 324
93% winners

Held = kept until it expired. Closed at 50% = bought back as soon as it could be for half the premium collected, a common way to manage these trades.

*Recorded setups, not trades placed: every setup SpreadVector's scanner recorded for each expiration (cash-secured puts and put spreads, 10/15/20 delta), one contract each, at the price the scan showed, after commissions. Held = valued at the stock's close on expiration day. Closed at 50% = bought back on the first day the closing price was half the credit or less; if that never happened, held. A winner made money. Past results don't guarantee future results.

How Today's Picks are chosen

From 800+ optionable stocks to 5 clear ideas

Every weekday morning. The counts change daily.

800+
Optionable stocks and ETFs

Everything SpreadVector covers. The full screeners search all of them.

400+
With weekly options

Today's Picks start here: the most actively traded names, scanned every hour for puts and spreads 30 to 45 days out.

170
Pass every check
No earnings before expirationLiquid optionsStrike untouched 60+ days
5
Today's Picks

Each chosen for one reason, explained card by card:

Above the 100- & 200-day moving averagesStrike below a support zoneIn an uptrendStrike untouched 90+ days

Last Touch: how long since the stock last closed at or below the strike.

For experienced traders

The full screeners, your settings

Already know what you want? Search 800+ optionable stocks and ETFs at live prices, with every filter, and see every result, not just the top 3.

Any delta and expirationMinimum Last Touch: 10 days to a year+Trend and support zonesExpected-move checkLiquidity on every rowEarnings hidden, or one click to show
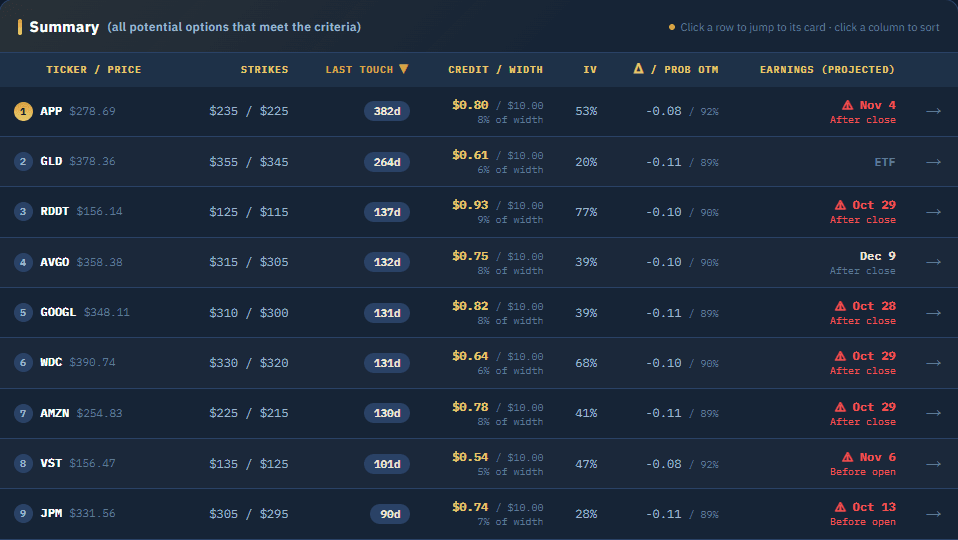
The Credit Spreads screener's summary table: ticker, strikes, Last Touch, credit, IV, delta and projected earnings

The Credit Spreads screener, sorted by Last Touch; ⚠ marks a report before expiration. Prob OTM is the market's estimate from delta, not a guarantee.

Everything in the full version
4 screeners
Short Puts and wheel stocks · Credit Spreads: bull puts, bear calls and iron condors · Post-Earnings Drift · Dividends
Every scan live, no limit
Live prices on every scan, as many as you want, with the full results list. Export to CSV, print or email.
All 5 of Today's Picks
Every weekday at 11:00 AM ET, at live prices, each explained in plain English.
My Trades
Log every position and see its live profit and loss, with an analysis of where each trade stands.
6 courses
Selling puts, credit spreads, covered calls, debit spreads, deep-in-the-money LEAPS and the poor man's covered call.
Command Center
Market sentiment, trade ideas, news and quick stats, on one page.
See the plans ›Starter from $19.99/month, or Pro with everything and a 7-day free trial. Cancel any time.

See what today's scan found

See today's 2 free picks ›

Free account, no card needed.

SpreadVector is an educational research tool. Every result is a starting point for your own research, not a recommendation to trade. Options involve risk and are not suitable for every investor. Option prices are indicative and the underlying stock price is delayed by at least 15 minutes. Always confirm in your broker before placing a trade.