- The expected move is the range the options market is pricing in for a stock by expiration.
- A quick way to estimate it: add the at-the-money put and call, then take about 85%, a common estimate.
- We want a put’s strike below the low end of that range. It doesn’t make a trade safe, but it keeps you from selling where the market already thinks the stock could go.
Most traders look at the premium, the delta and maybe the chart. Very few look at the one number the options market hands them for free: how far it expects the stock to move before the option expires.
What the expected move is
Option prices carry the market’s view of how much a stock might move. When traders expect big swings, options cost more. When they expect calm, options are cheap. The expected move turns those prices into a dollar range around today’s stock price, for one specific expiration.
It’s an estimate of a typical move, not a limit. Stocks move further than expected all the time. That’s exactly why it’s worth knowing where the line is.
Work it out in 10 seconds
Open the option chain for the expiration you’re trading and find the strike closest to the current stock price (the at-the-money strike).
- Add the at-the-money call premium and put premium. This gives you the straddle price.
- Multiply the straddle price by 85% to estimate the expected move. This is a rule of thumb, not a universal constant.
- Subtract the estimated move from the stock price to calculate the lower end of the range, and add it to calculate the upper end.
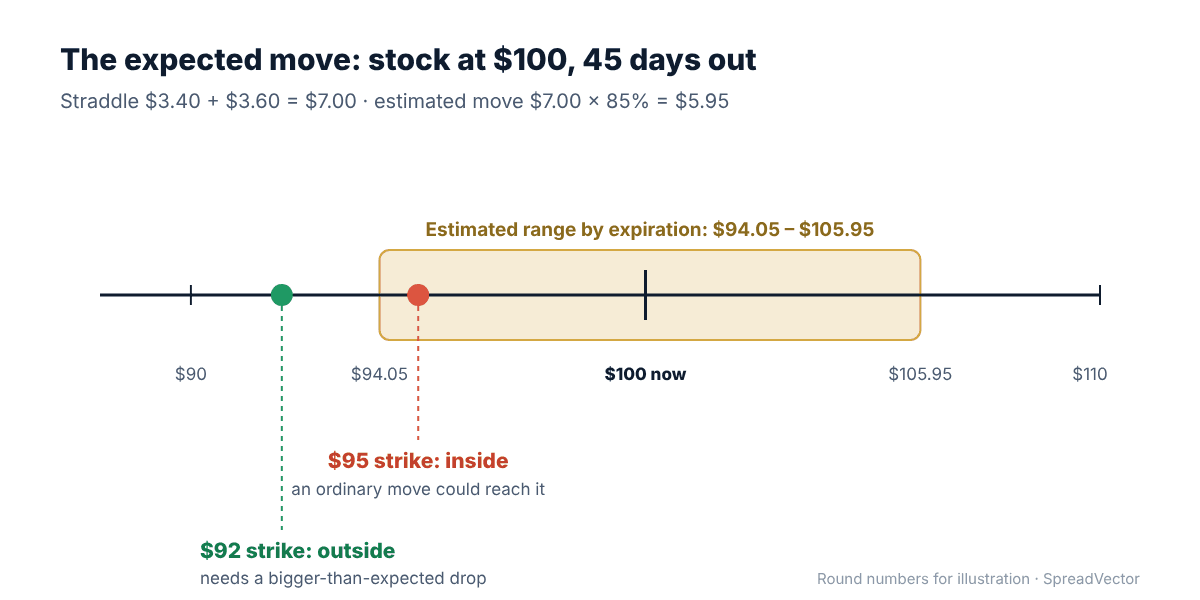
Example: A stock trades at $100 with 45 days until expiration. The $100 put costs $3.40 and the $100 call costs $3.60.
- Straddle price: $3.40 + $3.60 = $7.00
- Estimated move: $7.00 × 85% = $5.95
- Estimated lower end: $100 − $5.95 = $94.05
- Estimated upper end: $100 + $5.95 = $105.95
Estimated range by expiration: $94.05–$105.95. This is an approximation based on option prices, not a guarantee of where the stock will trade.
The 85% is an estimate, not a universal rule. Other methods, like the implied-volatility formula many brokers use, usually give a wider range. SpreadVector uses the 85% straddle method, so a strike that passes our check could sit inside a wider range your broker shows.
Where your strike should sit
- Short put: below the low end. In the example, a $95 strike is inside $94.05–$105.95: an ordinary move could reach it. A $92 strike is outside: the stock needs a bigger-than-expected drop to get there.
- Put spread: the strike you sell goes below the low end.
- Call spread: the strike you sell goes above the high end.
- Iron condor: both short strikes outside, one below and one above.
A real example: Goldman Sachs
On SpreadVector’s Short Puts screener on Oct 15, Goldman Sachs (GS) traded at $862.12. The Expected Move box for the Nov 20 expiration showed ±$57.21. That’s 85% of the at-the-money straddle, which works out to about $67.31. The estimated range by expiration was $804.91–$919.32.
The $790 put sits $14.91 below the low end of the range, so GS would need a bigger-than-expected drop to reach it. The card’s “Outside Expected Move: Yes” tag says the same thing. The video above runs the same check on Alcoa and Silver.
Example only, not a recommendation. Live prices from SpreadVector’s screener, Oct 15, 2026.
A lot of traders never look at the expected move. After earnings, it’s the first number I check.
What it doesn’t tell you
- It’s today’s estimate. It changes as prices change, and it shrinks as expiration gets closer.
- Earnings blow it up. Before a report, the expected move gets much wider, because the market is pricing in the gap. That’s one more reason we skip puts with earnings before expiration.
- It says nothing about history. A strike can sit outside the expected move and still be a price the stock hit last week. That’s what Last Touch is for. The expected move tells you what the market is pricing in; Last Touch tells you what actually happened.
SpreadVector shows the expected move on every Short Puts and Credit Spreads result, in the Expected Move box, and the standard scan keeps only strikes outside it (try the full screeners free for 7 days).
Use it with the other checks
All the checks in one place: Before you sell a put: 5 checks every time, plus 1 of 2.
Quick answers
Is the expected move the most a stock can move?
No. It's the market's estimate of a typical move. Bigger moves happen, especially around news and earnings.
Why 85% of the straddle?
It's an estimate, not a universal rule: a widely used rule of thumb for turning the straddle price into a typical move. Brokers using the volatility formula usually show a wider range.
Does a strike outside the expected move mean the put expires worthless?
No. It means the stock needs a bigger-than-expected move to reach it.
Which expiration do I use?
The one you're trading. A 30-day and a 45-day option on the same stock have different expected moves.
All 5 picks every weekday at 11:00 AM ET, each with its Last Touch and why it made the list, and every screener for 7 days.
- All 5 of Today's Picks, at live prices
- 4 screeners across 800+ stocks and ETFs: Short Puts, Credit Spreads, Earnings Drift and Dividends
- Set your own delta, expiration and minimum Last Touch (10 days to a year+)
- Courses and Command Center
SpreadVector is a screening and education tool, not investment advice. Options involve risk and aren't suitable for every investor. The worked example uses round numbers for illustration; the Goldman Sachs example uses live screener prices from Oct 15, 2026, and doesn't include commissions.