- Last Touch = trading days since the stock last closed at or below your strike.
- Two strikes with the same delta can have very different histories: one the stock left 10 months ago, one it was at 2 weeks ago.
- It’s one check among several, never a promise.
When you sell a put, the strike decides almost everything: how much you collect, how much cash you set aside, and whether you end up owning the stock. Most guides tell you to pick the strike by delta. Delta is useful (we use it too), but it only tells you what the options market expects. It doesn’t tell you where the stock has actually been.
That’s the gap Last Touch fills.
What Last Touch is
Last Touch is the number of trading days since the stock last closed at or below your strike.
- A Last Touch of 9 means the stock was at your strike about two weeks ago.
- A Last Touch of 500 means it hasn’t closed there in about two years.
We use closing prices, not intraday lows, because the close is where the market settled at the end of the day.
Two real strikes, side by side
Both of these were put spreads from our scan at Friday’s close (Oct 9), both expiring Nov 20, both with the same delta, and both with the strike outside the expected move. On those numbers alone they look alike. The charts tell a different story.
Costco: $870 strike, Last Touch 200
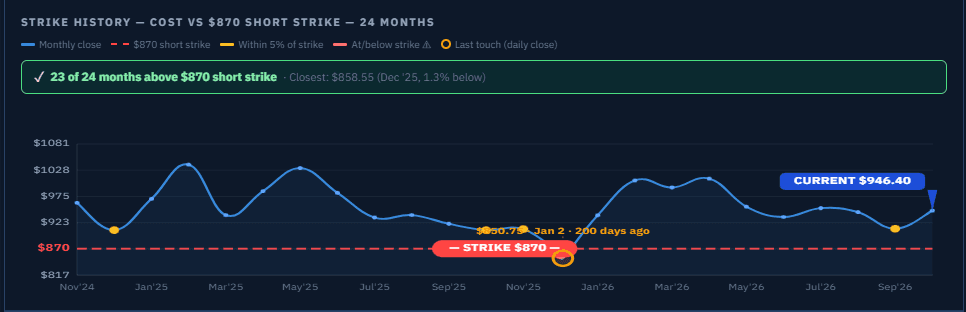
To reach this strike, Costco would have to fall back to a price it hasn’t closed at since the start of the year.
Accenture: $175 strike, Last Touch 9
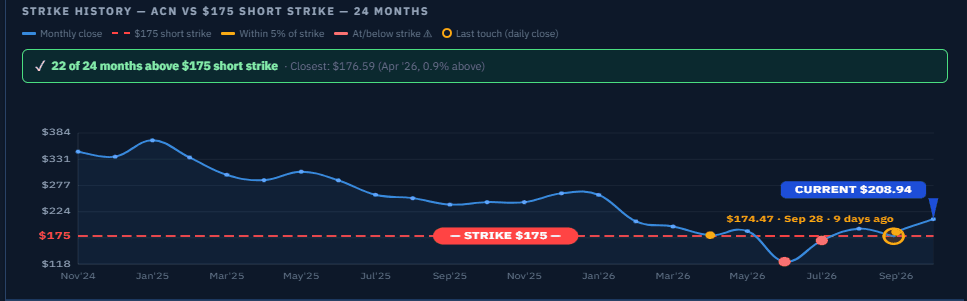
Accenture’s strike is further away on paper, yet the stock closed at $174.47 on Sep 28, just 9 trading days earlier, after a long slide that took it below $175 in June and July. That’s what Last Touch makes visible.
And at the long end
Our Today’s Picks on the same day included a Kroger $55 put with a Last Touch of 503: Kroger hadn’t closed at or below $55 in about two years.
| Strike | Last Touch | Roughly |
|---|---|---|
| Accenture $175 | 9 | 2 weeks |
| Costco $870 | 200 | 10 months |
| Kroger $55 | 503 | 2 years |
Nine trading days, ten months and two years: three strikes, three very different histories, all invisible if you only look at delta.
The trade-off
On the same stock, a strike further below the price usually has a longer Last Touch and pays less premium. A strike the stock touched recently pays more because the market knows it can get there. There’s no “right” answer: it’s how much you want to collect against how much room you want. Last Touch puts that choice in front of you instead of leaving it to guesswork.
How we use it
- Today’s Picks only include strikes with a Last Touch of at least 60 trading days.
- The full screeners show Last Touch on every setup across 800+ stocks and ETFs, and you choose the minimum yourself, from 10 days to more than a year, with the Min days since strike last visited setting (try them free for 7 days).
60 isn’t magic. It’s a starting point that keeps out strikes the stock was trading at a few weeks ago, while still leaving enough premium to be worth the trade.
The numbers come back in seconds: no earnings before expiration, the strike outside the expected move, the stock trending up, and how long since it last closed at our strike. Then comes the one minute we never skip: we read the news. The numbers tell you where a stock has been. A headline can change where it’s going.
What Last Touch doesn’t tell you
- The past isn’t a floor. A stock that hasn’t been at your strike in 500 days can get there in a week after bad news or a market sell-off.
- It says nothing about earnings. A long Last Touch doesn’t help if the company reports before your expiration. We skip those trades entirely.
- Uptrends inflate it. A stock that’s risen steadily shows long Last Touch numbers on many strikes. Check the trend is still intact.
- New listings have short histories. A stock that’s only traded for a year can’t show a two-year Last Touch.
That’s why Last Touch is one check among several, never the only one.
Use it with the other checks
All the checks in one place: Before you sell a put: 5 checks every time, plus 1 of 2.
Quick answers
Does Last Touch use intraday lows?
No, daily closes. A stock can dip below your strike during the day and recover; the close is what counts.
Is it calendar days or trading days?
Trading days. 200 trading days is about 10 months; 500 is about two years.
How many days is enough?
We start at 60. Longer means more room and usually less premium. Pick the balance that fits you.
Does it work for ETFs?
Yes, the same way.
All 5 picks every weekday at 11:00 AM ET, each with its Last Touch and why it made the list, and every screener for 7 days.
- All 5 of Today's Picks, at live prices
- 4 screeners across 800+ stocks and ETFs: Short Puts, Credit Spreads, Earnings Drift and Dividends
- Set your own delta, expiration and minimum Last Touch (10 days to a year+)
- Courses and Command Center
SpreadVector is a screening and education tool, not investment advice. Options involve risk and aren't suitable for every investor. Examples use closing prices from Oct 9, 2026 and don't include commissions.