- Two real Oracle put spreads, 10 contracts each, back to back: the Nov 20 $105/$95 on October 22, and the Nov 20 $110/$100 on November 4.
- Both strikes had a Last Touch of over 2 years, both sat below the same support area near $120, and both passed every check, after Oracle’s September earnings.
- I closed the first in 5 days for +$660 and the second in 7 days for +$570, each at 55% of the credit: +$1,230 before commissions.
The rule both trades shared
Last Touch is the last time a stock closed at or below a given strike. If the answer is “last month,” the stock has been there recently and could go back. If it’s “Over 2 years,” the stock hasn’t closed at or below that price in more than 504 trading days. SpreadVector’s Over 2 years scan finds those strikes by itself. I explain the idea in Last Touch, and you can see how the scan’s first 114 setups turned out in Last Touch Over 2 Years: 114/114 Winners.
A put credit spread is two puts on the same stock and expiration. You sell one and buy a cheaper one at a lower strike. You collect a credit up front, and the put you buy caps your loss.
This fall I sold two of them on Oracle, two weeks apart, both expiring November 20. Both short strikes had a Last Touch of over 2 years. The second came straight from the Over 2 years scan.
The checks, both times
Before I sell any put or put spread, I run the same checks. Five every time:
- No earnings report before expiration. Oracle reported on September 10, and both trades came after it. Its next report comes in December, after November 20.
- A low delta. Both short puts were in my range.
- The strike outside the expected move. Both were.
- A tight bid/ask spread. Oracle’s options are liquid.
- Last Touch: Over 2 years. ORCL hadn’t closed at or below either strike in more than two years.
Then one of two: the stock is above its 100- and 200-day moving averages, or there’s a support zone above the strike. Both times, ORCL was below both averages, so the trend check didn’t pass. Support decided it, both times. ORCL had a strong support area around $120, and both short strikes sat below it.
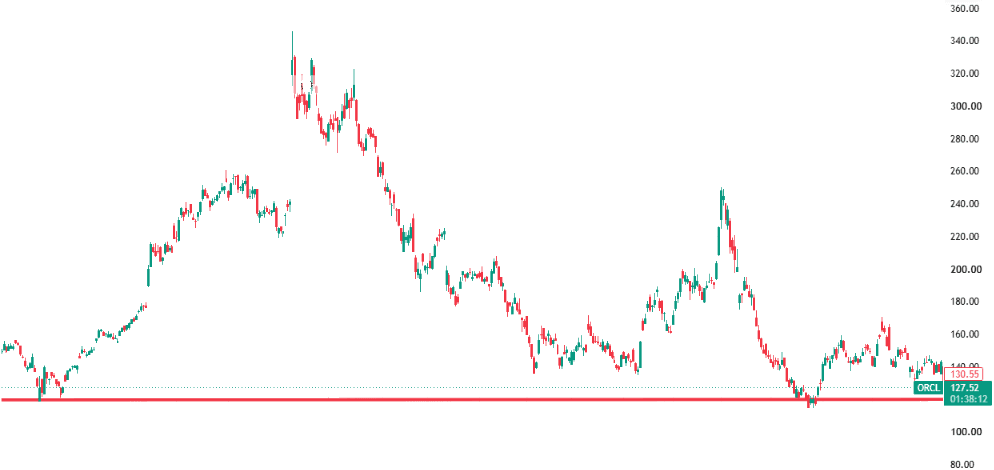
I explain each check in Before you sell a put: 5 checks every time, plus 1 of 2.
Trade 1: October 22, closed in 5 days
On Thursday, October 22, with ORCL at $126.35, I opened 10 put spreads expiring November 20, 29 days out:
| Sold | $105 put | $1.99 |
| Bought | $95 put | $0.80 |
| Credit | $1,190 for 10 contracts | $1.19 |
My short strike sat about 17% below the stock, and $15 below support. The most I could lose was the $10 width minus the $1.19 credit: $8,810 for 10 contracts.
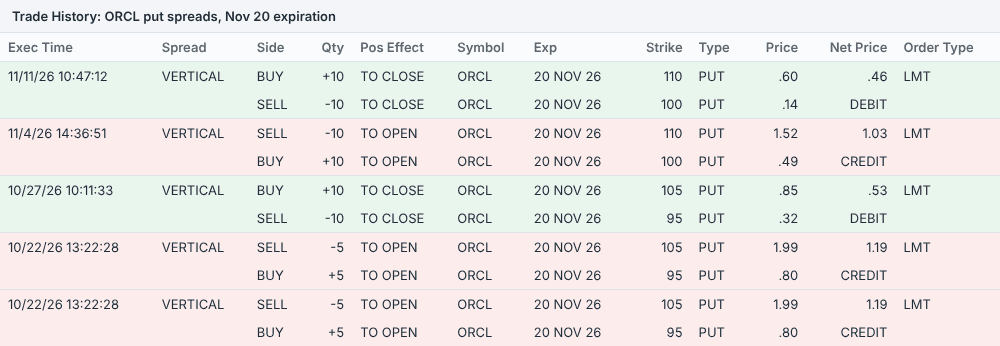
My closing rule is simple. If the market gives me 50% of the premium, or close to it, within a couple of days or a week, I take it. The next week, ORCL opened up about 3.6% on Tuesday, October 27, as traders positioned ahead of its Investor Day the following day. At 10:11 AM I closed all 10 spreads:
| Bought back | Nov 20 $105 put | $0.85 |
| Sold | Nov 20 $95 put | $0.32 |
| Cost to close | $0.53 |
That’s +$660 in 5 days. I kept 55% of the credit.
Trade 2: November 4, closed in 7 days
A week later, ORCL was back down near the same support. On Wednesday, November 4, it opened at $121.78, and the Over 2 years scan had the $110/$100 put spread. That afternoon I opened 10 of them, 16 days out:
| Sold | $110 put | $1.52 |
| Bought | $100 put | $0.49 |
| Credit | $1,030 for 10 contracts | $1.03 |
This short strike sat about 10% below where ORCL opened, and $10 below support. The most I could lose was $8,970 for 10 contracts.
It was a volatile week. Then, on November 10, CoreWeave, another AI cloud company, reported strong results and raised its guidance. That eased the market’s worry about how AI companies pay for their growth, and the next morning AI-related stocks went up with it. By 10:45 AM on November 11, Oracle was up about 7%. At 10:47 AM I closed all 10 spreads:
| Bought back | Nov 20 $110 put | $0.60 |
| Sold | Nov 20 $100 put | $0.14 |
| Cost to close | $0.46 |
That’s +$570 in 7 days. Again, I kept 55% of the credit.
The result
That’s $1,230 before commissions, in 12 days of holding two trades. Measured against what I had at risk, the first made about 7.5% and the second about 6.4%.
If either one had gone against me
Neither did, but I always have a plan in place before I open a trade. If ORCL had broken through $120 and kept going, I’d have followed the same rules I used when gold fell through my strike: My GLD put spread went against me.
What I take from it
Same stock, same support, same checks, two different weeks. I didn’t know what would move Oracle either time, and I didn’t need to. What I could control was where my strikes sat: below support, at prices Oracle hadn’t closed at or below in more than two years.
The rules behind both trades are in my book, The Toll Booth Method: how I pick strikes, the checks I run, and what I do when a trade goes against me. It’s on Kindle, in paperback, and free with Kindle+ (formerly Kindle Unlimited).
You can check any stock’s Last Touch with SpreadVector’s free Last Touch Checker, and a free week shows the Over 2 years setups with every check already run.
Two real trades by the author, shown with every fill. Prices don’t include commissions.
Use it with the other checks
All the checks in one place: Before you sell a put: 5 checks every time, plus 1 of 2.
Quick answers
Why sell a second spread on the same stock so soon?
The first was closed. A week later ORCL was back near the same support, and a new strike passed every check again, so I took it as a new trade.
Why close at 55% instead of holding to expiration?
My rule is to take 50% of the premium, or close to it, when it shows up within a couple of days or a week. Both times it showed up within a week, so I took it.
Did you know what would move Oracle?
No. The first time it was the run-up to Investor Day, the second time a strong report from CoreWeave. I didn’t trade around either. The strikes, the support zone and the checks were the parts I controlled.
Is 10 contracts the norm?
Yes. I trade 10 contracts on about 99% of my trades.
All 5 picks every weekday at 11:00 AM ET, each with its Last Touch and why it made the list, and every screener for 7 days.
- All 5 of Today's Picks, at live prices
- 4 screeners across 800+ stocks and ETFs: Short Puts, Credit Spreads, Earnings Drift and Dividends
- Set your own delta, expiration and minimum Last Touch (10 days to a year+)
- Courses and Command Center
SpreadVector is a screening and education tool, not investment advice. These are two real trades by the author, shown with every fill; two trades say nothing about the next. Options involve risk and aren't suitable for every investor. Prices don't include commissions. Past results don't guarantee future results. News from public reports; chart from TradingView.