What Last Touch is
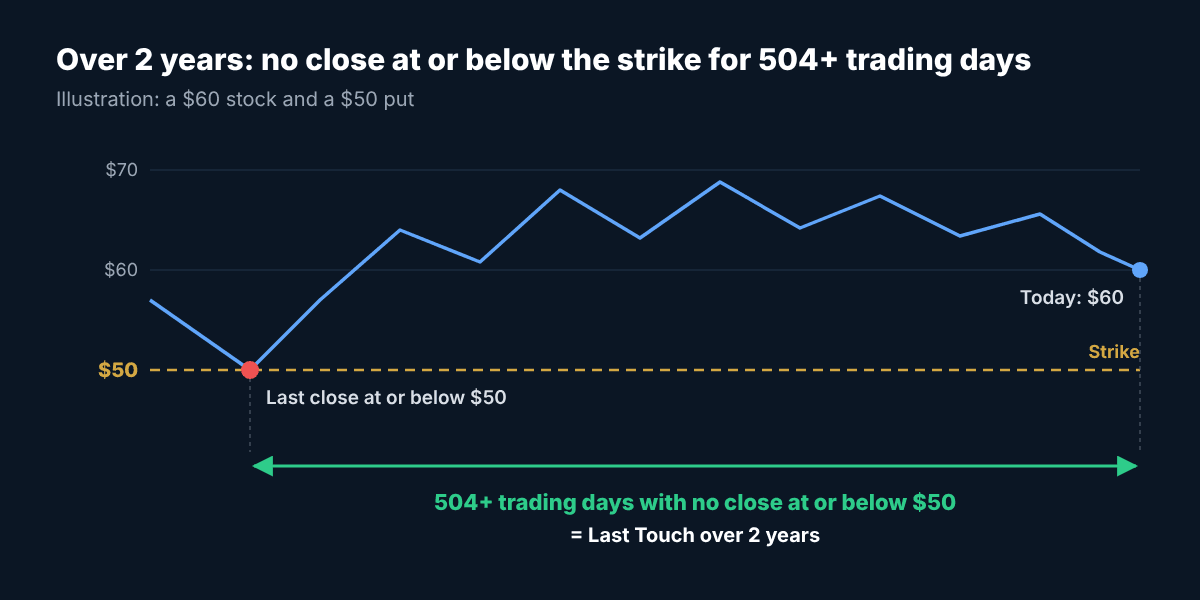
Last Touch is the number of trading days since a stock last closed at or below a given strike price.
Say a stock trades at $60 and you’re thinking about selling the $50 put. If the stock closed at or below $50 three weeks ago, that price was tested recently. If it hasn’t closed that low in more than two years (504 trading days or more), the stock has stayed above that price for a long time. That is what “Last Touch over 2 years” means.
How it started
Over 2 years began as a test on my own trades. I wanted to answer one question: if I sold a put at a strike the stock hadn’t closed at or below in more than two years, how often would that trade end up a winner?
It held up. So I asked a bigger question. What happens if we run the same test on every stock, every week, and publish every result? That is what we do now at SpreadVector, and this post is the first look at the numbers.
114 of 114
SpreadVector’s Over 2 years scan finds those strikes on its own; nobody chooses them by hand.
Every setup the scan flags is recorded and graded at expiration. Since October 16, it has flagged 114. All 114 were winners, both held to expiration and closed at 50% of the credit. Trading one contract per setup, the closed-at-50% results on our homepage add up to +$4,831.
A “winner” here is a recorded setup that finished profitable, not a trade someone placed. Past results don’t guarantee future results.
October 30
The market dropped on October 30. It’s never pleasant to watch, and my first move on a day like that is always the same: I go through the positions I’m managing and decide which ones need to be closed, rolled or left alone.
Once that’s done, I look at the stocks that have been beaten down and nibble at a few. If nothing stands out, I do nothing. Managing what I already own comes first.
How I use it in my own trades
I still run my standard checks before every trade. Five of them, every time:
- No earnings report before expiration
- A low delta, 10 to 15
- The strike outside the expected move
- A tight bid/ask spread
- Last Touch: how long since the stock was at the strike
Then one of two: the stock is above its 100- and 200-day moving averages, or there’s a support zone above the strike. I explain each one in Before you sell a put: 5 checks every time, plus 1 of 2.
My usual rules stay in place too:
- Only sell a put on a stock I’d be happy to own at the strike
- Risk no more than 5% of the account on one trade
- Hold no more than two positions in the same industry
- Close around 50% of the credit
When a setup passes all of that and its strike also has a Last Touch over two years, that’s what brings me over the finish line.
See every result
Every expiration is on the SpreadVector homepage, and the record only grows: each new expiration is added once its setups are graded. The Over 2 years scan is on the screener, and it picks the strikes automatically.
| Expiration | Held | Closed at 50% |
|---|---|---|
| Oct 16 | 72 of 72, +$3,542 | 72 of 72, +$2,317 |
| Oct 30 | 42 of 42, +$4,068 | 42 of 42, +$2,514 |
| Nov 6 | 22 of 22, +$1,726 | 22 of 22, +$961 |
| Nov 13 | 12 of 12, +$557 | 12 of 12, +$321 |
*Recorded setups, not trades placed: every setup SpreadVector's scanner recorded for each expiration (cash-secured puts and put spreads, 10/15/20 delta), one contract each, at the price the scan showed, after commissions. Held = valued at the stock's close on expiration day. Closed at 50% = bought back on the first day the closing price was half the credit or less; if that never happened, held. A winner made money. Past results don't guarantee future results.
Want to check one strike yourself? The free Last Touch Checker shows how long since any stock we cover last closed at or below it, or try it free for a week.
Past results don’t guarantee future results. Options involve risk and aren’t suitable for everyone.
Use it with the other checks
All the checks in one place: Before you sell a put: 5 checks every time, plus 1 of 2.
Quick answers
What does Last Touch over 2 years mean?
The stock hasn't closed at or below the strike in 504 or more trading days, about two years.
Are these real trades?
They're recorded setups: every one the scan found, one contract each, at the price the scan showed. Not trades someone placed.
Who picks the strikes?
Nobody. The Over 2 years scan finds them automatically each day.
Can I check a strike myself?
Yes. The free Last Touch Checker at spreadvector.com/tools/last-touch shows it for any stock we cover.
All 5 picks every weekday at 11:00 AM ET, each with its Last Touch and why it made the list, and every screener for 7 days.
- All 5 of Today's Picks, at live prices
- 4 screeners across 800+ stocks and ETFs: Short Puts, Credit Spreads, Earnings Drift and Dividends
- Set your own delta, expiration and minimum Last Touch (10 days to a year+)
- Courses and Command Center
SpreadVector is a screening and education tool, not investment advice. Options involve risk and aren't suitable for every investor. Results are recorded setups, one contract each, not trades placed. Past results don't guarantee future results.